

An Introduction
By Josh Howe, Associate Professor of History and Environmental Science, Reed College
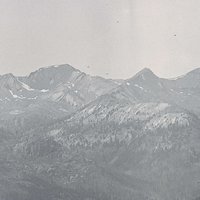
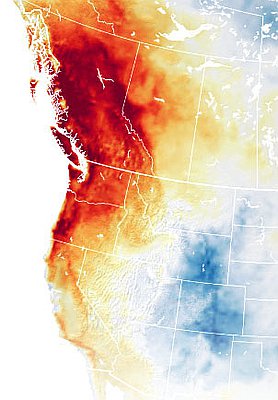
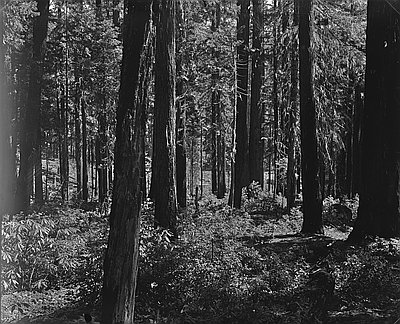
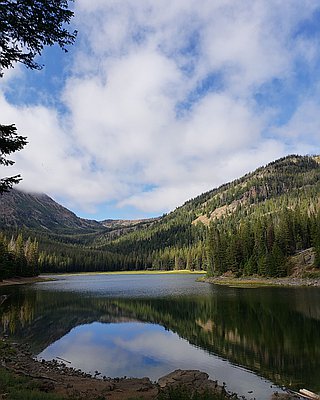
In Oregon, within a few hundred miles you can see snowy volcanoes, parched deserts, semiarid grasslands, alpine meadows, and coastal temperate rain forests. On any given day, the weather across the state can range from freezing cold to baking hot, from bone dry to soaking wet, from tranquil to tempestuous. Oregon regularly experiences the extremes of average precipitation, temperature, humidity, and wind characteristic of the North American West. Some places in the Coast Range, for example, receive as many as 200 inches of rain in some years, while the rain shadow of Steens Mountain in eastern Oregon sometimes receives as little as five inches. But even highly variable weather creates patterns over time, and scientists use the word climate to describe those patterns over decades, or even centuries.
Oregon’s climate is not only diverse, it is also changing. In geological time—the intervals of time that geologists use to chart changes and sequences of events in the rock record—Oregon’s climate has vacillated between tropical and arctic. Since the Industrial Revolution, however, human activity has contributed to changes in the Earth’s climate, causing geological change on shorter, human timescales. Scientists refer to the changes that humans make to climate as anthropogenic Climate Change, which have occurred largely as a result of changes in the composition of the atmosphere, particularly through the emission of greenhouse gases like CO2 that increase the overall temperature of the Earth. Because anthropogenic climate change, on balance, increases the overall temperature of the planet, it is also often referred to as anthropogenic warming or, more commonly, global warming. The terms are not perfectly interchangeable, but both have been used to describe the causes of the climate crisis, a term scientists and concerned citizens often use to refer to the related negative effects of an increase in average global temperatures on animal and human populations, as well as the ecosystems and infrastructure on which they rely.
What does climate change look like in Oregon?
We asked the experts.
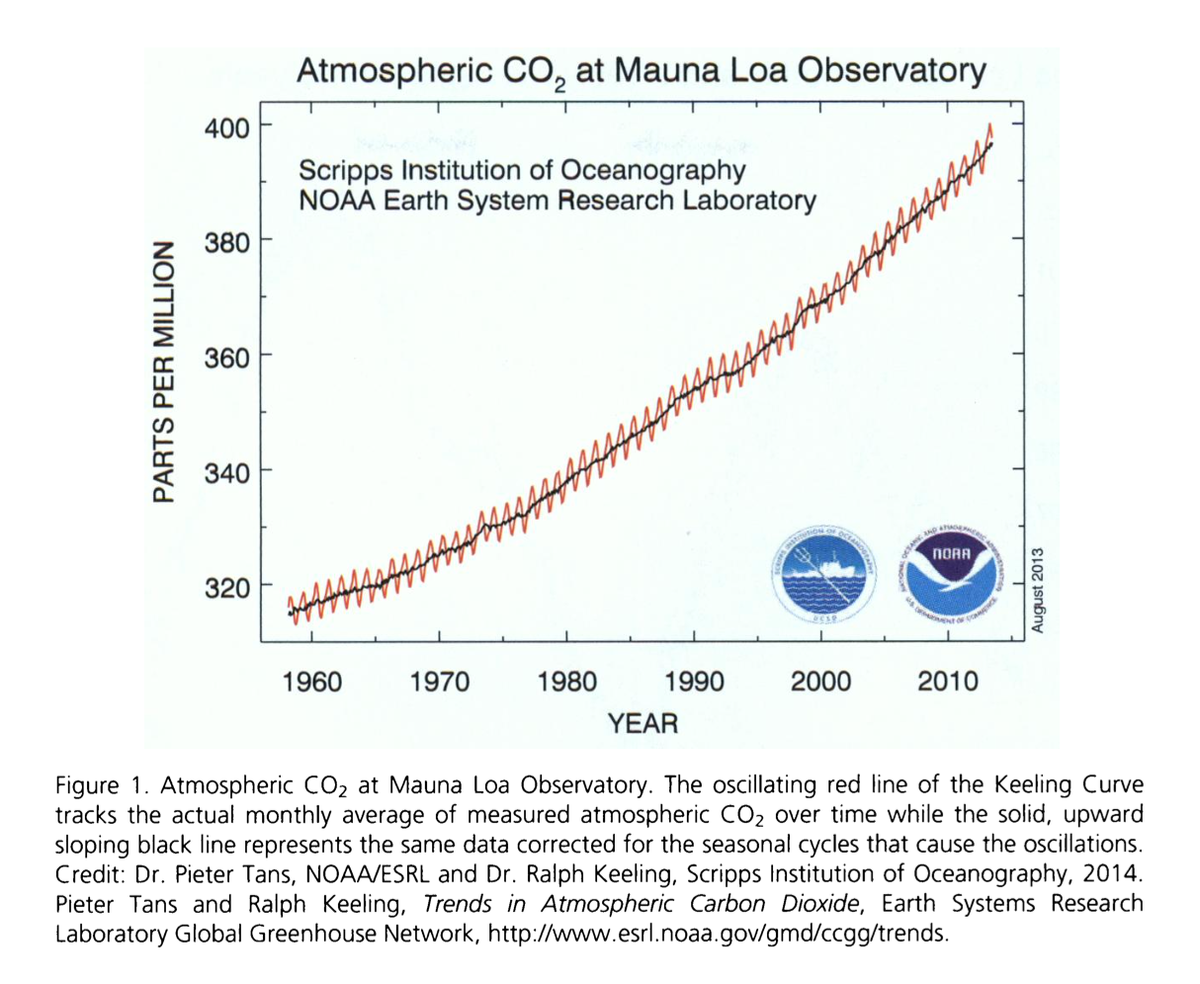
Josh Howe writes that the Keeling Curve is a "form of storytelling" that has two concurrent parts: the story of the seasonal oscillation of the life cycle of plants—what he calls the "breathing" of the Earth—and the story of humans burning fossil fuels. The first is a story of "nature"; the second is a story of "un-nature." Humans historically have "collapsed" or conflated their activity with natural processes. The Keeling Curve untangles that conflation, revealing that the "tension between the natural and the unnatural embedded in the two lines" informs "the recent emphasis in climate change discourse." When people realized they were "agents of geophysical change," they were able to locate themselves on a collective "anthropogenic timeline," opening the way to a reconsideration of "narratives of modernity."
Keeling Curve
The Keeling Curve is a graphic representation of the concentration of CO2 (carbon dioxide) in the atmosphere. In 1958, climate scientist Charles Keeling, who worked at the California Institute of Technology, began testing air samples for CO2 at the Mauna Loa Observatory in Hawaii and in Antarctica. He recorded changes in CO2 concentrations throughout the day, from month to month and year to year. Plotting the data on a graph, he demonstrated the correlation between rising CO2, which contributes to a warming planet, and an increase in the use of fossil fuels by humans. Scientists continued adding new data to the graph along a continuous timeline, making the Keeling Curve a valuable tool for recording—and visually understanding—how the history of human activity, the rise of CO2, and climate change are connected.
"The Keeling Curve, the oscillating upward-sloping graph of measured atmospheric carbon dioxide (CO2)," environmental historian Joshua Howe wrote, is "one of the most important and powerful scientific symbols of anthropogenic [human-caused] climate change. It may seem odd to read a simple measure of atmospheric gas through the many-sided prism of modern American life the way you might read a historical photograph or piece of art. And yet the Keeling Curve functions as much as a symbol in our collective understanding of climate change as it does a representation of data about CO2." [Howe, "This is Nature; This is Un-Nature: Reading the Keeling Curve," Environmental History 20 (2015): 286-93.]
A brief history of Climate Change in Oregon
This timeline includes some of Oregon's contributions to Climate Change and its efforts to mitigate it. We begin a million years ago and then zoom in to human habitation and activity during the decades when technology and fossil fuels were used to transform the water, the land, and the air. The timeline jumps in time to illustrate how quickly the climate has changed since the end of the eighteenth century. Through the timeline, we can see how human activity after the start of the Industrial Revolution warmed the Earth over a century or two. We can also see when people realized the dangers of a too-rapidly changing climate and began a flurry of scientific study and strategic planning, all in an effort to hold off a global disaster.


Understanding the language of climate change
The study of a rapidly changing climate is somewhat recent. As our understanding of the world has changed, so has the language we use to describe it. Agreeing on the definitions of the words and phrases connected to Climate Change is essential to the cooperative effort among scientists, political leaders, and the general public to address the effects of a warming planet. Knowing the difference between "weather" and "climate," for example, helps push the conversation forward toward shared understandings and goals.
Climate Change Resource Index
This index provides links to agencies, organizations, and news sites that provide information to everyone on global warming and climate change. These resources have been evaluated by OE staff for their science-based approach and readability. Many of the sites are directly relevant to the effects of Climate Change in Oregon, while others take a national and global view. The resources are divided into five categories: Teaching Climate Change in Oregon; Databases, Charts, and Graphs; Native Americans and Climate Change; Climate Change Activism; and Climate Change in Arts and Culture.

Climate Change 101
Short Video Answers to Common Questions about Climate Change
Video 1: Basic Terms
Video 2: "Do scientists disagree about the causes of Climate Change?"
Video 3: "Where does CO2 come from?"
Video 4: "Isn't more carbon dioxide in the atmosphere good for plants?"
Video 5: "What is the difference between weather and climate?"
Video 6: "Hasn't the Earth gone through periods of warming and cooling long before humans existed?"